


1929 stock market crash graph
The charts for the 1929 crash are a bit different, depending on whether you look at the S&P500 or the Dow Jones Industrial Average chart for the time frame. The 1929 crash followed a time of prosperity in the U.S. With the economy seemingly strong and stock markets forever rising, many invested everything they had in the markets. At the same time, buying on borrowed money, on margin, was popular. When the economy slowed down in 1929, the rising stock prices bubble burst and panic selling began, which resulted in a major market crash. No real recovery in the stock market occurred until the 1950's. Here's a graph (in png format) of the crash, done with Yahoo! Finance data and tools, showing the crash with data (the graph is in logarithmic scale) from October 1st, 1928, to October 7th 2005: 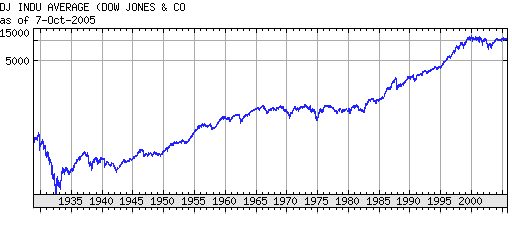 NYSE Stock Market Crash 1929 Graph 1929 Stock Market Crash Graph - ResourcesThere's one good resource that uses weekly Dow Jones Industrial Average data as well as S&P500 data in graph format, at about.com. The direct URLs to both the Dow Jones and S&P graph of the crash are:
These charts offer, however, limited view into the actual price action that went on during those times. To make the best of the data, you'll need actual quotes and then make the charts by yourself. The problem with getting quotes for individual stocks is that most were not around in the 1920s. That's why you have to rely on the major market indices for the 1929 stock market crash graph analysis, as this data is available. One source that gives out free quotes in easily downloadable format is djindexes.com. For example, historical values for the DJ Industrial average are available from 26-May-1896. The same goes for many sub-indexes, such as the Transportation index. You can modify the date ranges, as well as market cap range, currencies, and selection frequency (yearly, quarterly, monthly, weekly, daily). |